Set up widget parameters for Ad Hoc Metric by Category Widget
Ad Hoc Metric by Category Widget can display the same reporting information with 4 different visualization types:
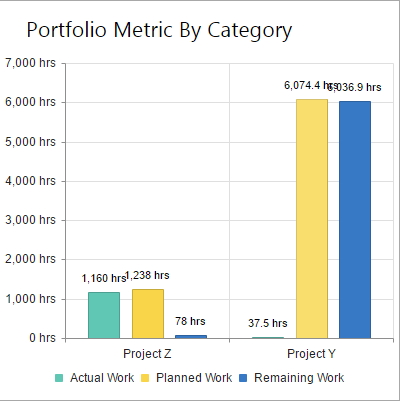
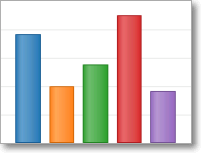
- Vertical Bar Chart
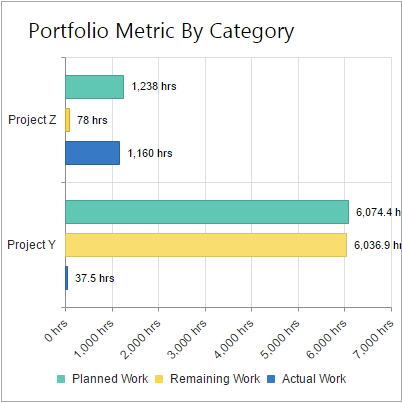
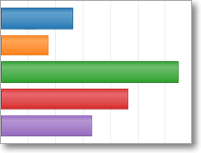
- Horizontal Bar Chart
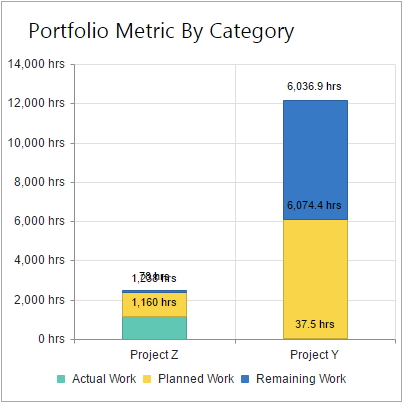
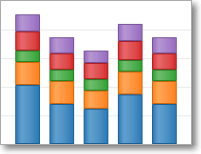
- Stacked Bar Chart
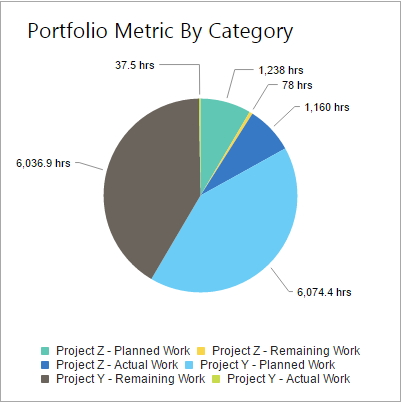
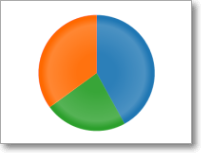
- Pie Chart
Visualization type can be defined when adding a new widget, i.e. select to add a widget that has a required visualization type set by default; or visualization type can be changed after the widget was added to a dashboard. Please refer to the Additional Widget Views article for more information about how to change the visualization type for the widget.
All Ad Hoc Metric by Category widgets have the same set of widget parameters, they only differ by the source of the information displayed in the widget, e.g. Portfolio Metric by Category widget will display information about projects, Tasks Metric by Category widget – information about tasks, and Resources Metric by Category widget will display information about resources.
1. Click on the widget to activate the widget menu and click the  button to open widget parameters.
Please note: Ad hoc metric by category widget parameters are presented on 4 tabs, such as Fields, Formats & Orders, Filter, and Misc.
Fields tab parameters are responsible for what information will be displayed in the widget, and the rest of the tabs are responsible for how it will be presented.
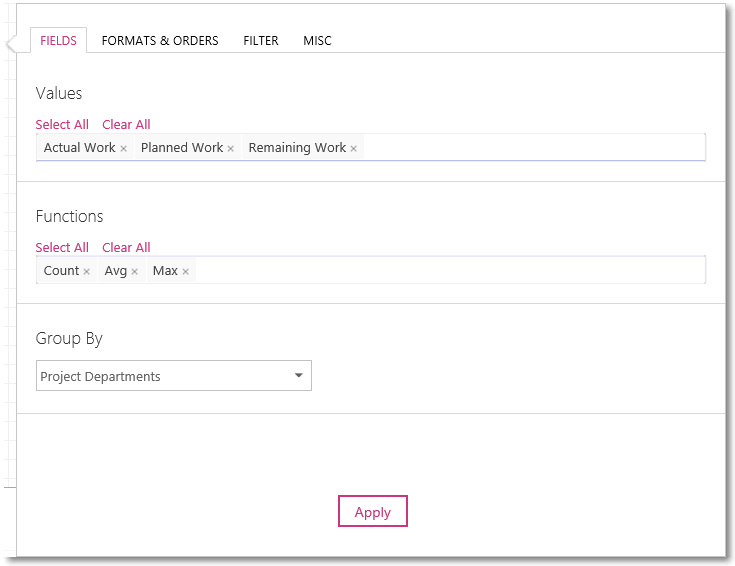
2. On the Fields tab define what fields will be displayed as values in the widget, aggregate functions and the category by which the values will be grouped:
a) First select the values, to do this click the Values section, and it will show a dropdown listing all fields available for this widget, click on the field to add it to the widget values.
You can add as many fields as you need. Values in the widget will be displayed in the same order as the fields added to the Values section.
Please note: To speed up the process of searching the fields that you need, just start typing the field’s name in the Values section, dropdown will display all the fields that contain the typed phrase.
Click on the field’s "X" button to remove the corresponding column from the widget.
b) Then select aggregate Functions for each of the values in the widget.
The following functions are available: None, Count, Sum, Avg, Max and Min. Click on the function to select it.
Select a function for each of the values in the same order as the values are presented in the Values section.
c) In the Group By dropdown select a field that will be used as a category by which the metric values will be grouped.
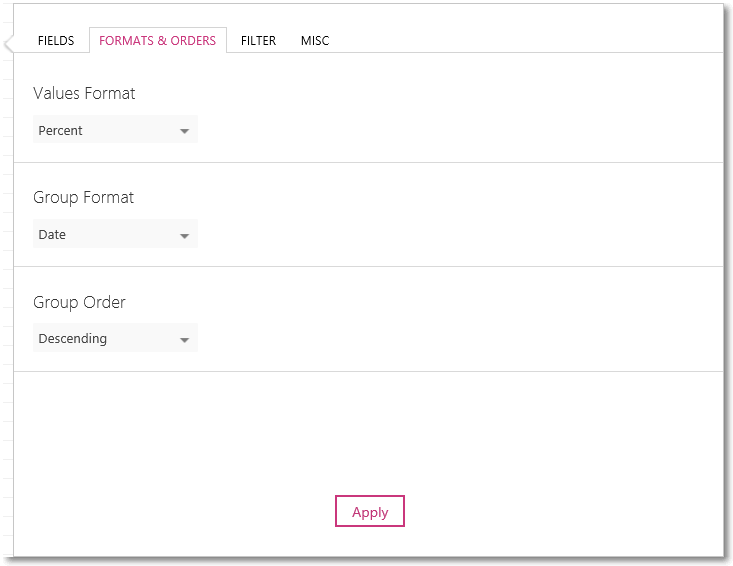
3. On the Formats & Orders tab you can define the values and group format, as well as the group order.
a) Set a specific Values Format for the values.
The following formats are available: None (can be used for strings, such as Project Name), Integer, Decimal, Cost, Percent, Duration, and Date.
b) Set a specific Group Format for the category by which the values are grouped.
Formats available are the same as for the values.
c) Select a Group Order from the dropdown – Ascending or Descending.
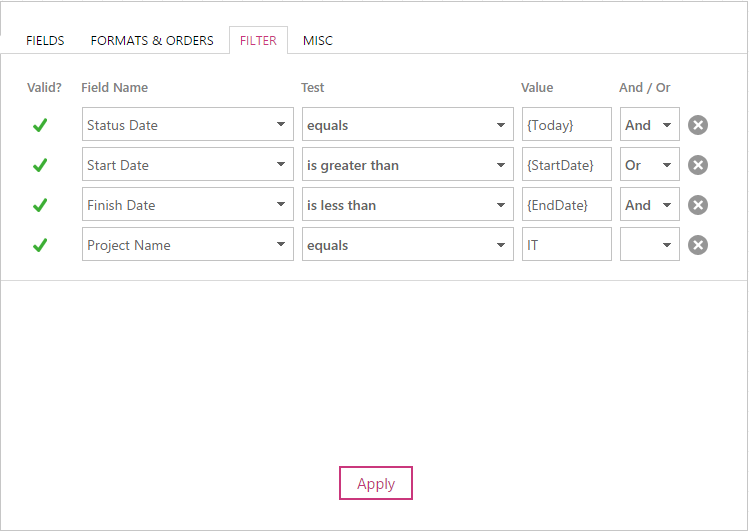
4. On the Filter tab, if needed, you can apply a filter in addition to the dashboard-wide Project Filter to filter out the data displayed in the widget.
To do this, select a field name and conditions.
Please note: If a date field is selected in the Field Name, then it is possible to filter the records by the following values:
- {Today}
- {StartDate}
- {EndDate}
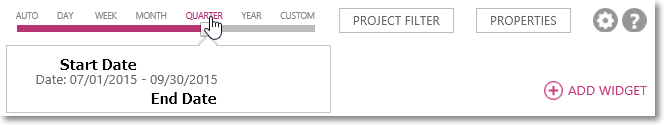
Where the {StartDate} and {EndDate} are the start and end dates of the dashboard timeline:
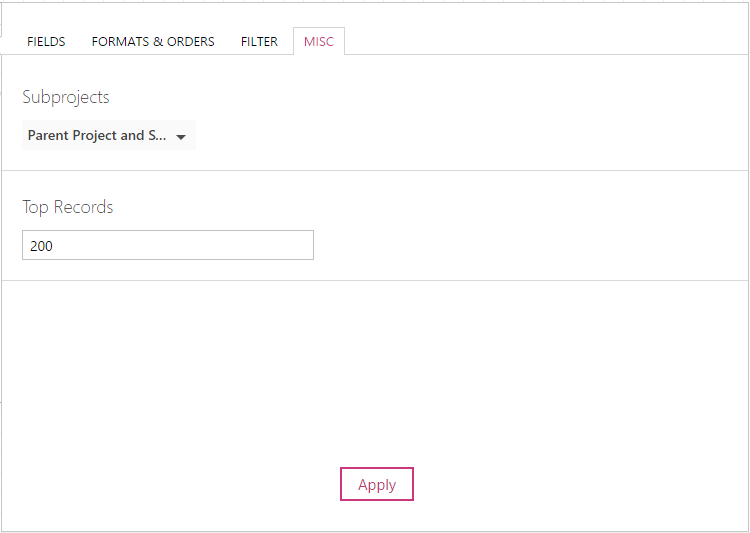
5. On the Misc tab you can define the following parameters:
a) In the Subprojects section select one of three options:
- No Subprojects: only parent (or master) projects will be displayed in the widget, subprojects will be hidden.
- Parent Project and Subprojects: both parent and subprojects will be displayed in the widget.
- Subprojects Only: parent (or master) projects will be hidden, and only subprojects will be displayed.
Please note: Projects will not be duplicated in the widget, if a project is already displayed due to the Project Filter settings, then it won’t be added one more time due to the Subprojects parameter.
b) In the Top Records section, you can limit the number of records displayed in the widget, e.g. if “100” is set for this field, then the widget will show only 100 top records.
Leave this field blank if you want the widget to return all the records.
6. Review the reporting information returned by the widget and edit the widget parameters if needed.