
This article contains step by steps instructions for creating a new table widget Portfolio Summary that will display the following information for non-complete projects:
- Project Name
- Project Owner
- Project % Completed
- Project Start Date
- Project Finish Date
- Project Cost
- Project Work
Creating a Widget and Providing Basic Information
- Open Widget Editor.
- Click NEW WIDGET.
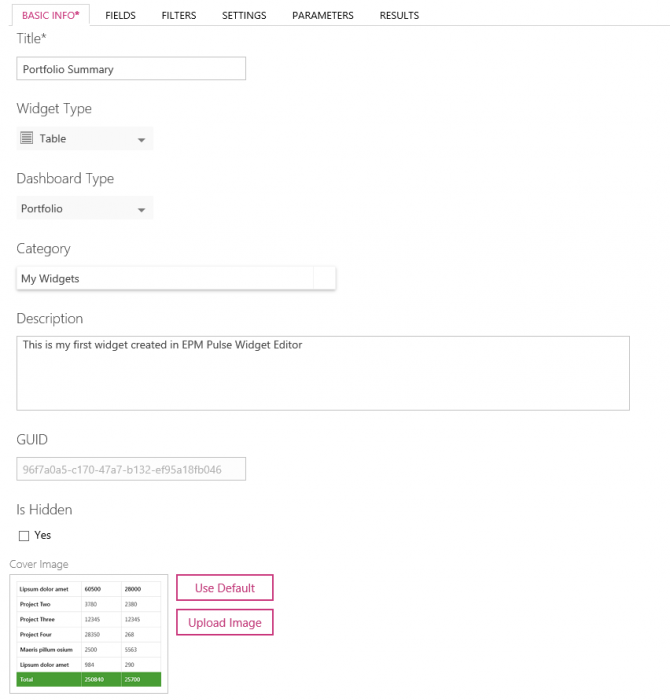
- Open the Basic Info tab.
- In the Title field type a title of a new widget, for example “Portfolio Summary”.
- From the Widget Type drop down select “Table”.
- From the Dashboard Type drop down select “Portfolio”.
- In the Category combo box type or select a desired category for a widget, for example “My Widgets”. (Please note that if such category does not exist, it will be created upon saving the widget.)
- In the Description field provide a description for the widget.
- To set up a custom cover for the widget click the Upload Image button and select an image from the disk.
Defining Widget Data
- Open the Fields tab.
- In the Data Sources list select Projects.
- In the Showcolumn check the check-boxes next to the following fields:
- ProjectName
- ProjectOwnerName
- ProjectPercentCompleted
- ProjectSummaryTaskStartDate
- ProjectSummaryTaskFinishDate
- ProjectCost
- ProjectWork
- ProjectUID
Note: It is not mandatory to select the ProjectUID field, but we will use it on a later stage for creating a drill down. It is recommended to use ProjectSummaryTaskStartDate and ProjectSummaryTaskFinishDate instead of just ProjectStartDate and ProjectFinishDate, as they may contain incorrect values under some circumstances.
- In the Display Name column type desired names for the selected fields.
- In the Sort column select a sort order next to one of the selected fields, for example, set Desc next to the ProjectSummaryTaskStartDate and Asc next to the ProjectName.
- In the Format column select formats for each column, for example, select Cost for ProjectCost and Date for ProjectSummaryTaskStartDate.

- In the Cols order list reorder the selected columns as needed using the Up and Down buttons.


Defining Widget Filters
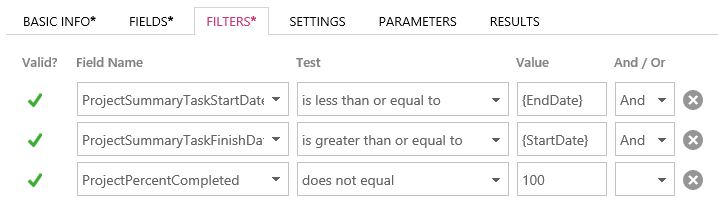
- Open the Filters tab.
- Set up the following filter to filter out completed projects ProjectPercentCompleted does not equal 100.
Note: for some data sources filters may already be defined, in this particular example, there will be filters that filter projects by Dashboard Timeline, so that widget will display only those projects that intersect with the Timeline period. To add a new filter to the existing ones just select a condition in the And / Or column.
Defining Widget Settings
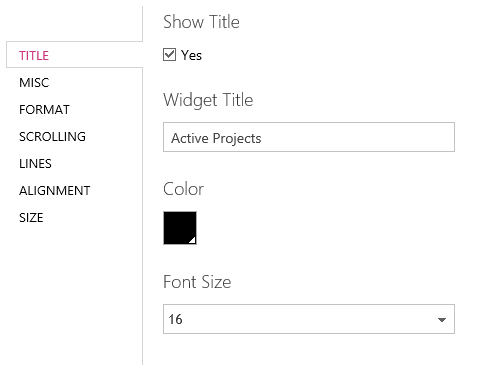
- Open the Settings tab.
- Set up default values for widget settings if required, for example, set widget Title to “Active Projects”.
Defining Widget Parameters
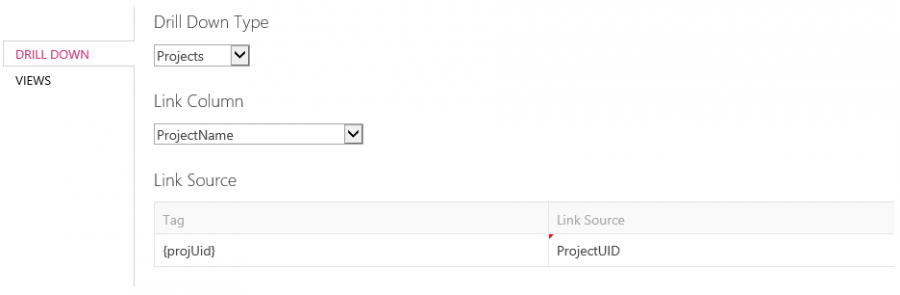
- Open the Parameters tab.
- Select the Drill Down parameter.
- Select Projects in the Drill Down Type drop down.
- Select ProjectName in the Link Column drop-down as the column where the Drill Down link will be displayed.
- In the Link Source grid select ProjectUID next to the {ProjectUID} tag as the column containing project ID.
Verifying Widget
- Open the Results tab.
- Select a few projects in the Project Filter.
- Check contents of the widget.

- Click Save in the toolbar to complete the widget creation process.
