|
Title |
Resource History by Category |
|
Description |
Displays aggregated field value over time |
|
Type |
Stock Chart |
|
Hidden |
No |
|
Views |
Current |
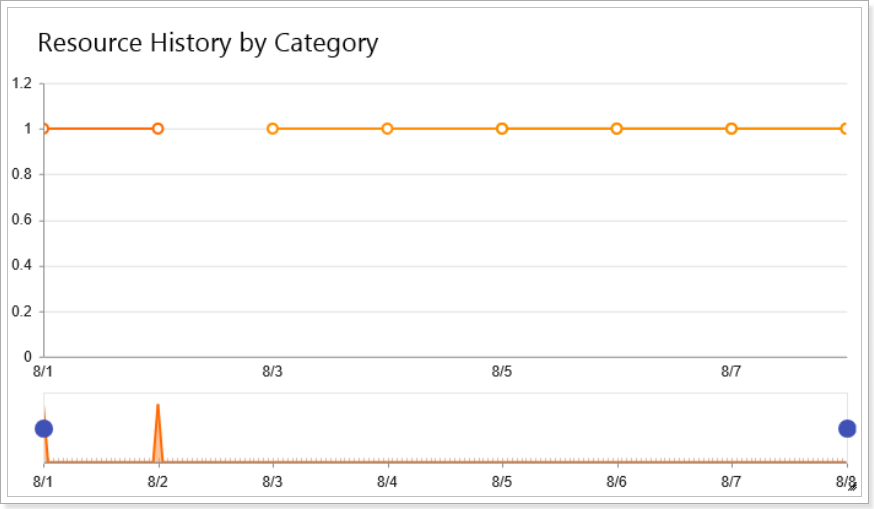
Resource History by Category widget displays information about Resources over time with breakdown by selected category.
When you open a widget it is empty as you need to configure it first. Please note that there should be information on your PWA that can be displayed in this widget. Here is an example of how to configure a widget showing Standard Rate changes over time Grouped by Resource Name:
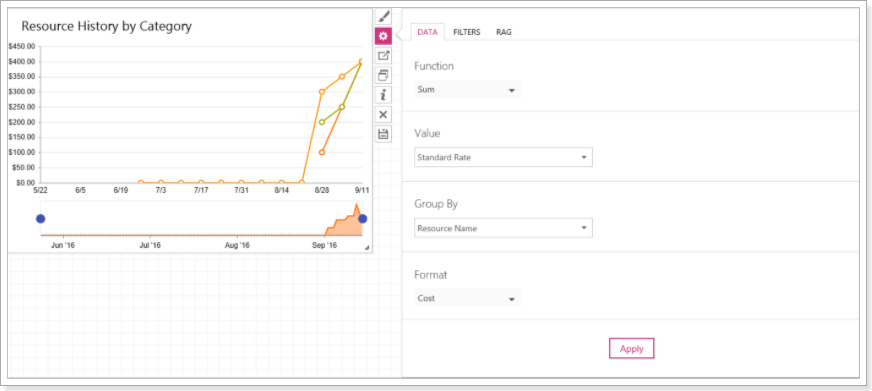
- In the Function section select an aggregate function, to do this click on the Function section, and it will show a dropdown listing all available functions: Count, Sum, Avg, Max and Min. Click on the function to select it.
- In the Valuesection choose the data you want to see in the widget. You can always navigate to the line and it will show what information it displays exactly.

- In the Group By section choose the data select a field that will be used as a category by which the values will be grouped.
- Set a specific Format for the value. The following formats are available: None, Integer, Decimal, Cost, Percent, Duration, Work(hours), Duration(days) and Date, HTML.
- Click Apply button to apply the parameters to the widget.
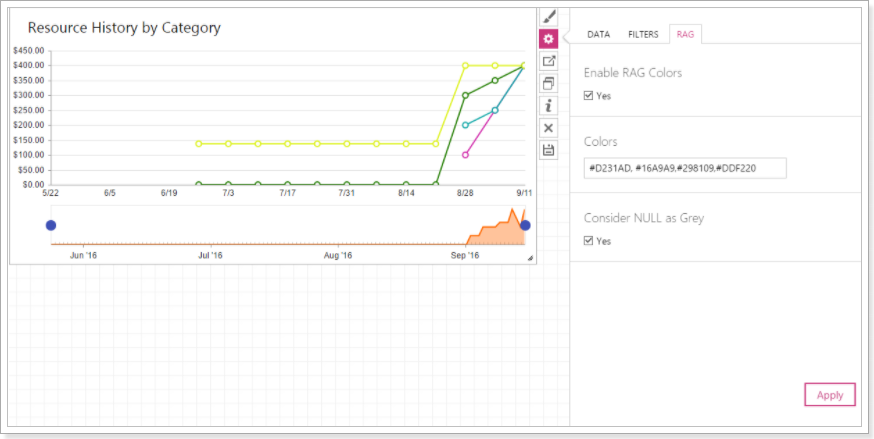
There is also a possibility to change colors of the lines displayed in the widget.
- On the RAG tab check the Enable RAG Colors checkbox.
- In the Colors section provide the colors you want the widget to display: HEX color codes or color names.
- Click Apply button to apply the parameters to the widget.
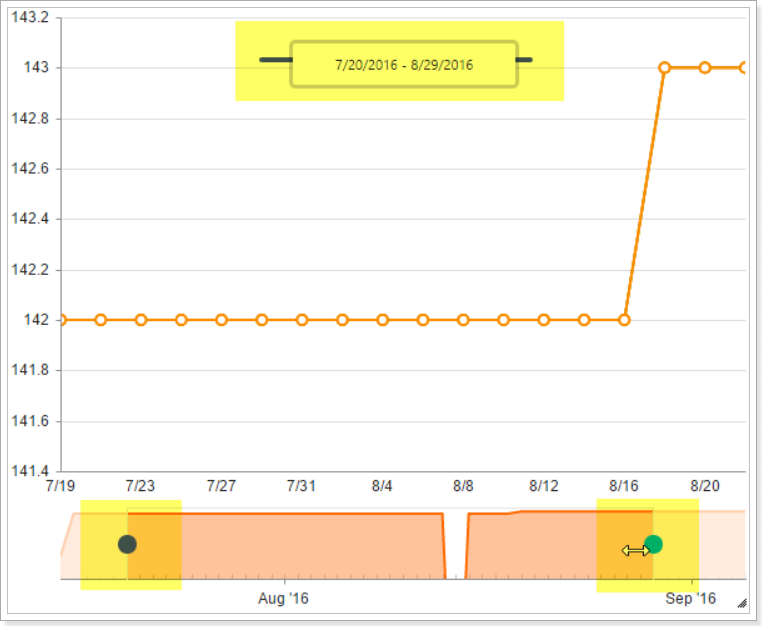
As all other trending widgets, Resource History widget has a timeline filter:
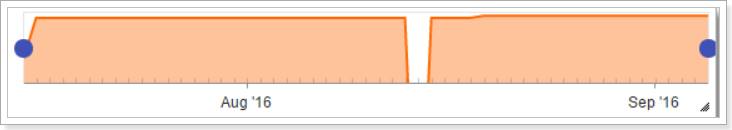
Click and drag the blue dots to adjust the time period in the timeline: