|
Title |
Resource History |
|
Description |
Displays aggregated field value over time |
|
Type |
Stock Chart |
|
Hidden |
No |
|
Views |
Current |
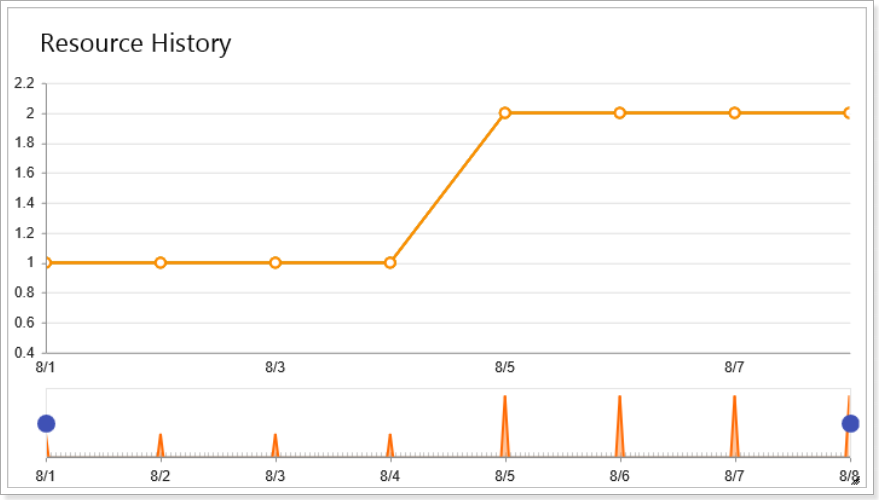
Resource History widget displays information about Resources over time.
After you add this widget to a dashboard, it is empty as you need to configure it.
Please note that in order for trending data to become available in EPM Pulse, changes should take place on your PWA first, and the data should be synchronized with EPM Pulse.
Here is an example of how to configure a widget showing Standard Rate and Overtime Rate changes over time:
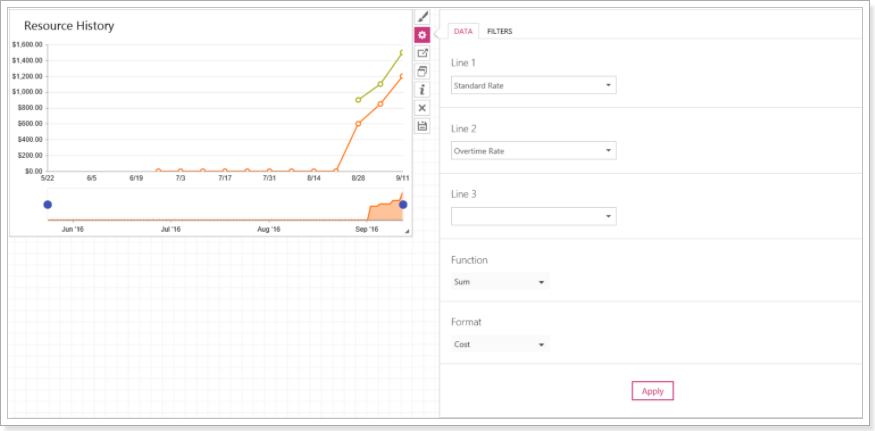
1. In the Line 1, Line 2 and Line 3 section choose the Resource Field that you want to display in the widget.
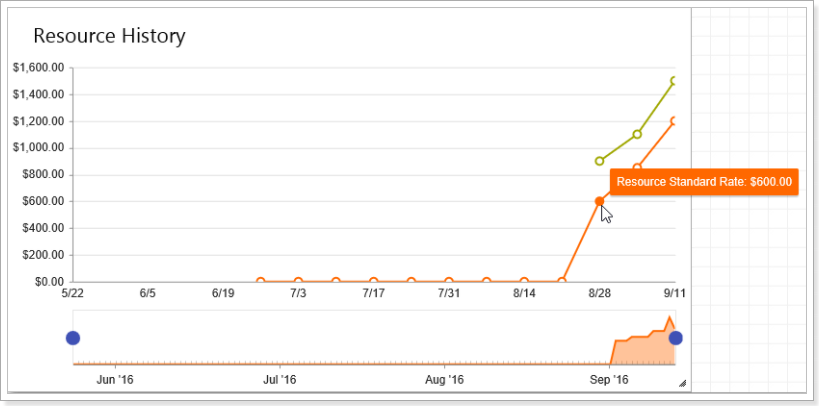
If you choose Standard Rate, as in the example, for the Line 1 section, then this line will be orange in the widget. Line 2 is green and Line 3 is yellow.
You can always navigate to the line and it will show what information it displays exactly.
2. In the Function section select an aggregate function, to do this click on the Function section, and it will show a dropdown listing all available functions: Count, Sum, Avg, Max and Min. Click on the function to select it.
3. Set a specific Format for the metric value. The following formats are available: None, Integer, Decimal, Cost, Percent, Duration, Work(hours), Duration(days) and Date, HTML.
4. Click Apply button to apply the parameters to the widget.
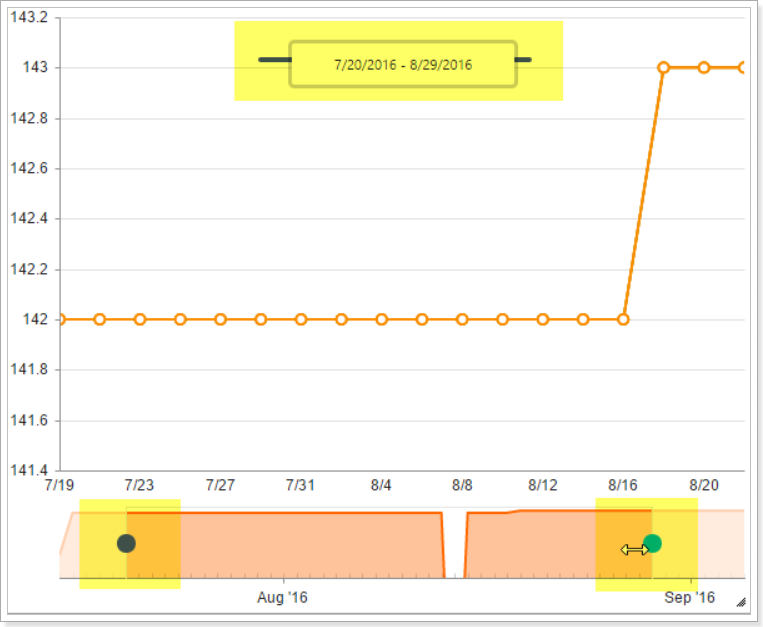
As all other trending widgets, Resource History widget has a timeline filter:
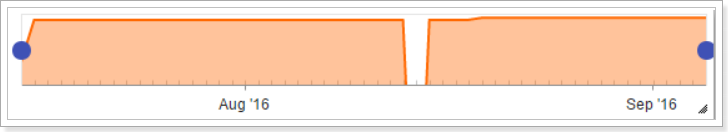
Click and drag the blue dots to adjust the time period in the timeline: