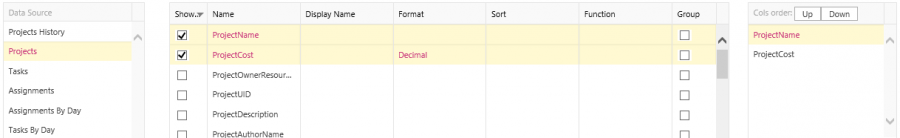
In order to build a widget you need to select the correct data structure on the Fields tab. This means that selected fields should have the correct data type and order and for some widget types they should also have certain names.
Data type of a field comes from SQL Server and you can distinguish between field data types by the predefined value in the Format column on the Fields grid.
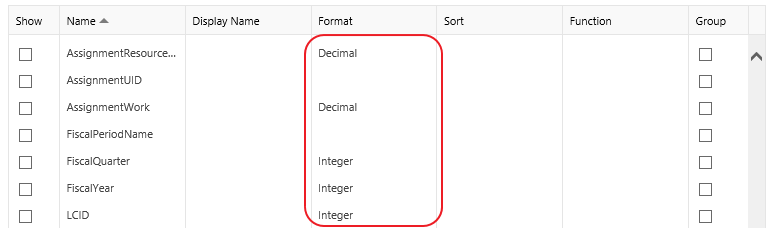
Below is a list of possible data types:
|
Format Value |
Data Type |
| <empty> |
Number |
| Decimal |
Decimal |
| Integer |
Number |
| Date | Date |
In order to set up columns order use the Cols order list-box next to the Fields grid where you can re-order selected fields using the Up and Down buttons.
Below you can find the correct data structures for each widget type.
Please note: “1..n”,”2..n”, etc. in the Order column means that the widget can display more than one series of data.
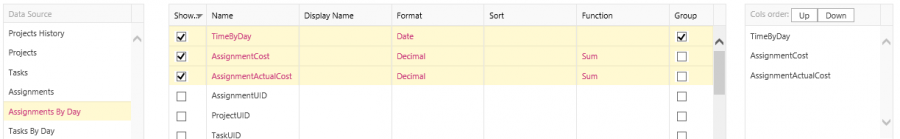
Area Chart
|
Order |
Type |
| 1 |
Date |
| 2..n |
Number |
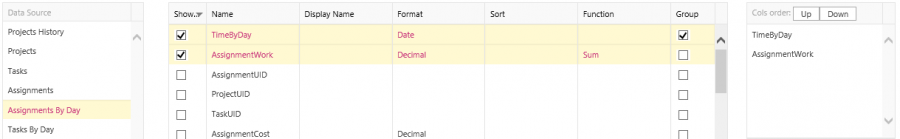
Example: Assignment Costs by Day
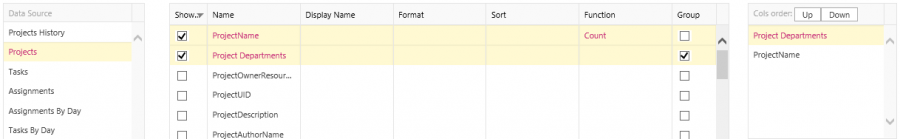
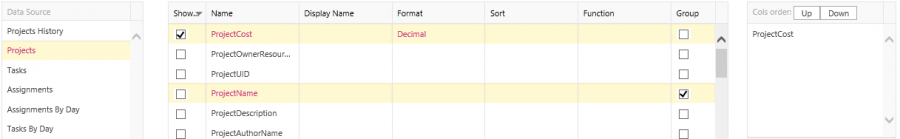
Bar Chart
|
Order |
Type |
| 1 | Any |
| 2..n | Number |
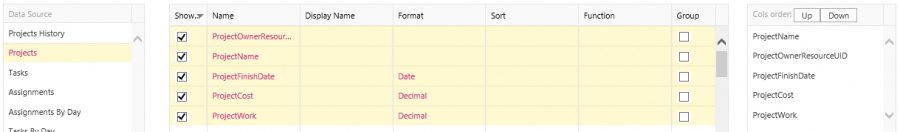
Example: Projects by Department
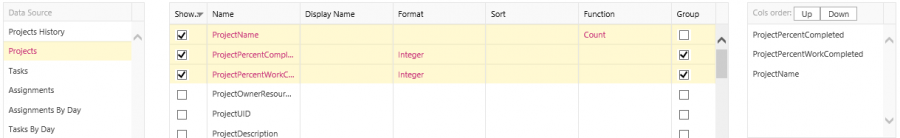
Bubble Chart
|
Order |
Type |
| 1 |
Number |
| 2 |
Number |
| 3 |
Number |
Example: Projects by % Complete and % Work Complete
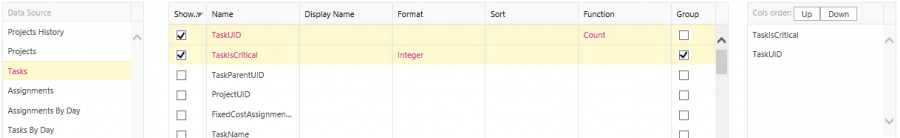
Column Chart
|
Order |
Type |
| 1 | Any |
| 2..n |
Number |
Example: Tasks by Critical Status

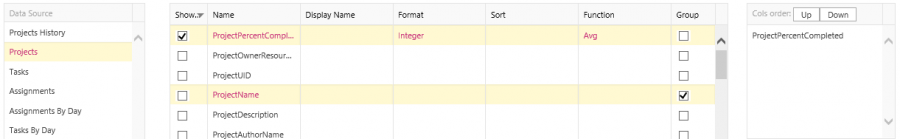
Gauge Chart
|
Order |
Type |
| 1 | Number |
Example: Portfolio Average % Complete
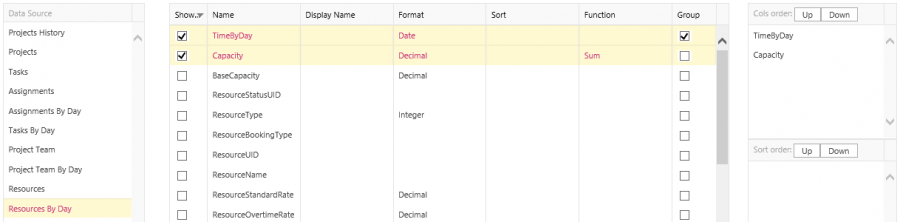
Heatmap Table
|
Order |
Type |
| 1 |
Any |
| 2..n | Number |
Example: Resource Capacity by Day
Indicator
| Order | Type |
| 1 | Any |
Example: Portfolio Average Cost

Line Chart
|
Order |
Type |
| 1 | Date |
| 2..n | Number |
Example: Assignment Work By Day

Pie Chart
|
Order |
Type |
| 1 |
Any |
| 2..n |
Number |
Example: Tasks by Critical Status
Scalar
|
Order |
Type |
| 1 |
Any |
Example: Portfolio Average Cost
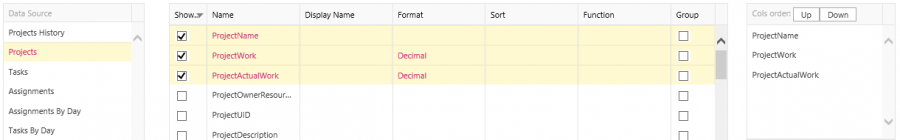
Scatter Chart
|
Order |
Type |
| 1 |
Any |
| 2 | Number |
| 3 | Number |
Example: Projects by Work and Actual Work
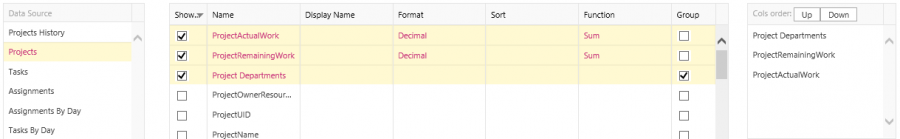
Stacked Column
|
Order |
Type |
| 1 | Any |
| 2..n | Number |
Example: Portfolio Actual and Remaining Work by Department
Stock Chart
| Order |
Type |
| 1 |
Date |
| 2..n | Number |
Example: Assignment Work By Day
Table
| Order | Type |
| 1..n | Any |
Example: Portfolio Summary
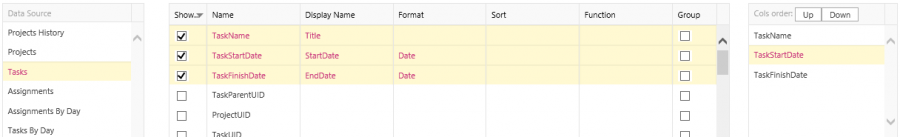
Timeline
Timeline requires columns named in a certain way.
| Order | Type |
Note |
| 1 | Any | Display Name should be “Title” |
| 2 | Date | Display Name should be “StartDate” |
| 3 | Date | Display Name should be “EndDate” |
Example: Project Tasks
Treemap
|
Order |
Type |
| 1 | Any |
| 1 | Number |
Example: Project Costs